Financial Ratio
Earnings Per Share Ratio (EPS) and P/E Ratio (Price to Earning) are considered as two important ratios that should consider by every investor.
Financial ratios are considered as the best-standardized tool to access and compare the relative strength and performance of companies. A ratio is a relation between two numbers. And it can derive from dividing the one number by another. The primary sources for determining financial ratios are the company’s balance sheet and profit and loss account. We can produce various ratios using the figures in the balance sheet and profit and loss account. Ratios don’t make much sense. A ratio never tells us whether a company is good for investment or not. Rather, the meaning of ratios should be evaluated contextually. That is, a ratio should be evaluated differently across different industrial sectors.
Each of the ratios shows us some of the characteristics of companies, such as profitability, internal and external liquidity, efficiency, solvency etc. Ratio analysis certainly gives us some insight into the different aspects of a company. That’s why ratio analysis considered as the backbone of the fundamental analysis.
EPS Ratio (Earning Per Share)
Earnings per Share (EPS) is generally considered as the essential factor to determine share price and firm value. EPS represents the portion of a company’s earnings that is allocated to each share of the company.
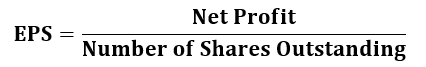
Earnings per share should be calculated by dividing the net profit or loss for the period attributable to equity shareholders by the number of equity shares outstanding during the period.
The number of equity shares should be the weighted average number of
equity shares outstanding during the period.
For Example:
A company had 45,000 shares for the first two months, and 63,000 shares for the remaining ten months of the accounting period. The calculation of the weighted average of the number of shares as
45,000 Shares x 2 Months = 90,000
63,000 Shares x 10 Months = 6,30,000
70,000 + 6,30,000 = 7,00,000
Weighted Average = 7,00,000 ÷ 12 = 60000
Here 60,000 is the weighted average number of shares outstanding during the period.
Calculation of Earnings Per Share
PQR Ltd. has a net income of 43,85,000, and the company declared a dividend of Rs. 13,85,000. Outstanding shares of the company during the accounting year is 1,00,000.
EPS = (43,85,000 – 13,85,000) / 1,00,000
EPS = 30.
From the shareholders’ perspective, EPS is an indication of the profitability of the company. In an investor point of view, EPS has three uses.
- Show the return on investment
- Show company’s retained profit
- Calculate the Price to Earnings Ratio
Suppose you buy a share at Rs. 600 with an EPS of Rs. 72. This means, your investment of Rs. 600 will earn Rs. 40 per year, that is 12%. From this 72, you may receive only Rs. 40 as dividend and the remaining 32 is retained (profit) by the company for reinvestment or future expansion. A company retained more profit is an indication of long-term growth. If a company makes a loss, then the EPS become negative.
EPS usually ignore the capital that used for generating the return. If two companies make the same EPS, and with different capital does not mean both companies profitability is the same. A company employ less capital is considered as a profitable company in this example.
To see the EPS of leading Indian companies – Click Here