Parameter Vs Statistic
Parameter and Statistic are two principal determines that help us to define the sample size for survey research. Both are very closely related. It is essential to understand the difference between these two terms. In the research domain, these two terms used interchangeably, and in the statistical vocabulary, we often deal with these terms.
Parameter
A parameter is the characteristic of the population. Population refers to any group of people or objects that form the subject of study in a particular survey that share common characteristics. It is the value obtained from the entire population, commonly known as the population parameter. This value may be any statistical value like mean, variance, standard deviation etc. In parameter, we consider all the elements in a population.
For example, all students in a class, all students in a college, all items in a shop, all employees in an organisation etc.
Workout: An organisation has 25 employees. We want to calculate the averge age of all employees.
25 + 34 + 45 + 28 + 34 + 65 + 34 + 43 + 29 + 45 + 54 + 34 + 32 + 48 + 53 + 28 + 46 + 37 + 64 + 36 + 34 + 54 + 50 + 46 + 27 = 1025
Average = 1025/25 = 41.
Here 41 is a population parameter. This value describes a characteristic of the entire population. Censuses are considered as the parameter about the population about the entire country. Because the census is an examination of each data element in the population under study. In real life research domain, the parameter value is unknowable but exists. In some situation, it is impractical to collect data from the entire set of elements of the population. It is challenging to collect the age of all employees in India, the age of all graduate students in the world, the salary of all software engineers in the world etc. To overcome this difficulty, here comes another measure called Statistic.
Statistic
A statistic is the characteristic of a sample. A sample is a subset or fraction of the population under study. It includes some selected elements of the population. The goal of the sample is to estimate a particular population parameter. So it is an estimate of the parameter. From the above example, we only consider 5 employees and calculate the average age. These 5 members would constitute the sample.
Workout : 45 + 43 + 34 + 37 + 36 = 195
Average = 195/5 = 39.
Here this 39 is a sample statistic. This value represents the entire population through the sample. A sample is a representation of the population.
The accuracy of the sample statistic depends on the method adopted for the selection of the sample. Despite the lack of accuracy, compared to the parameter, Statistic is the most convenient option for data collection.
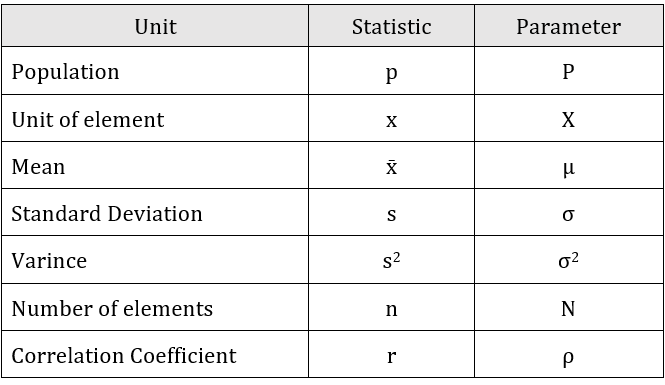
In statistics, the notation that represents the parameter and statistic is different. Following are some symbols using to describe the parameter and statistic. Parameters are usually Greek letters or capital letters. Statistics are typically Roman letters or small letters.


